Difference between revisions of "Coal Watch"
Jump to navigation
Jump to search
(Created page with "== Where == [https://wp.ansergy.com/coal-generation-watch/ Main Menu / Power / Generation / Coal Watch] File:Power-Generation-ISORecentOutages-Menu.jpg|alt=|none|thumb|400x4...") |
(→Where) |
||
| Line 1: | Line 1: | ||
== Where == | == Where == | ||
[https://wp.ansergy.com/coal-generation-watch/ Main Menu / Power / Generation / Coal Watch] | [https://wp.ansergy.com/coal-generation-watch/ Main Menu / Power / Generation / Coal Watch] | ||
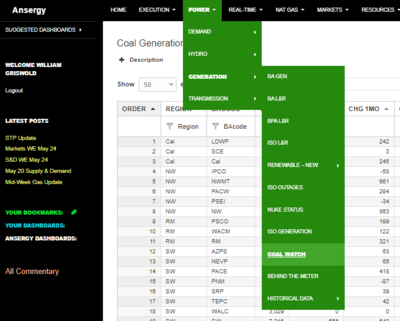
| − | [[File: | + | [[File:CoalWatchMenu.png|alt=Menu Location|none|thumb|400x400px|Menu Location]] |
= What = | = What = | ||
| + | This report summarizes the change in coal generation as sourced by EIA. Utilizing this report can effectively allow a user to monitor coal outages across the WECC. | ||
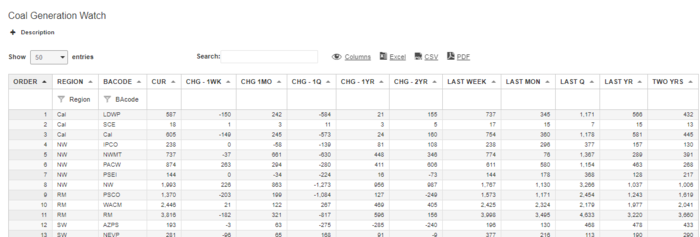
| + | [[File:CoalWatchTable.png|alt=Table Description|none|thumb|700x700px|Table Details]] | ||
| − | + | == Coal Watch Table Fields == | |
| − | + | * Region: Higher level aggregation for coal plant location (ie, Northwest, California, WECC, etc.) | |
| − | + | * BACode: The balancing authority for an associated coal plant | |
| − | + | * Cur: The current amount of MWs being generated within a respective balancing authority | |
| − | + | * Chg - 1WK: The difference between Current MWs and the MWs from One Week ago | |
| − | * | + | * Chg - 1MO: The difference between Current MWs and the MWs from One Month ago |
| − | * | + | * Chg - 1Q: The difference between Current MWs and the MWs from One Quarter ago |
| − | * | + | * Chg - 1Yr: The difference between Current MWs and the MWs from One Year ago |
| − | * | + | * Chg - 2Yr: The difference between Current MWs and the MWs from Two Years ago |
| − | * | + | * Last Week: The amount of MWs being generated One Week ago |
| − | * | + | * Last Mon: The amount of MWs being generated One Month ago |
| − | * | + | * Last Q: The amount of MWs being generated One Quarter ago |
| + | * Last Yr: The amount of MWs being generated One Year ago | ||
| + | * Two Yrs: The amount of MWs being generated Two Years ago | ||
== Related Reports == | == Related Reports == | ||
| − | * | + | * Coal Watch |
| − | |||
| − | |||
| − | |||
| − | |||
== | == | ||
Revision as of 08:08, 25 May 2021
Where
Main Menu / Power / Generation / Coal Watch
What
This report summarizes the change in coal generation as sourced by EIA. Utilizing this report can effectively allow a user to monitor coal outages across the WECC.
Coal Watch Table Fields
- Region: Higher level aggregation for coal plant location (ie, Northwest, California, WECC, etc.)
- BACode: The balancing authority for an associated coal plant
- Cur: The current amount of MWs being generated within a respective balancing authority
- Chg - 1WK: The difference between Current MWs and the MWs from One Week ago
- Chg - 1MO: The difference between Current MWs and the MWs from One Month ago
- Chg - 1Q: The difference between Current MWs and the MWs from One Quarter ago
- Chg - 1Yr: The difference between Current MWs and the MWs from One Year ago
- Chg - 2Yr: The difference between Current MWs and the MWs from Two Years ago
- Last Week: The amount of MWs being generated One Week ago
- Last Mon: The amount of MWs being generated One Month ago
- Last Q: The amount of MWs being generated One Quarter ago
- Last Yr: The amount of MWs being generated One Year ago
- Two Yrs: The amount of MWs being generated Two Years ago
Related Reports
- Coal Watch
==

