Difference between revisions of "ISO Generation Stack"
Jump to navigation
Jump to search
(Created page with "== Where == [https://wp.ansergy.com/eia-861m-detail/ Main Menu / Power / Generation / ISO Generation Stack] This report link can be found within the [https://wp.ansergy.com/e...") |
|||
| Line 1: | Line 1: | ||
== Where == | == Where == | ||
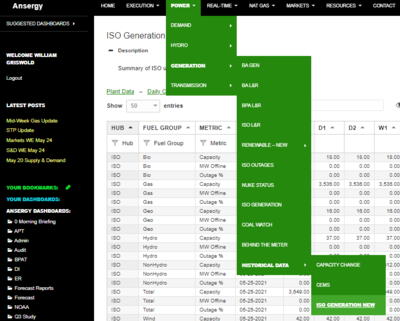
| − | [https://wp.ansergy.com/eia-861m-detail/ Main Menu / Power / Generation / ISO Generation Stack] | + | [https://wp.ansergy.com/eia-861m-detail/ Main Menu / Power / Generation / ISO Generation Stack] |
| − | |||
| + | [[File:ISO Gen Stack Menu.png|alt=Menu Location|400x400px]] | ||
= What = | = What = | ||
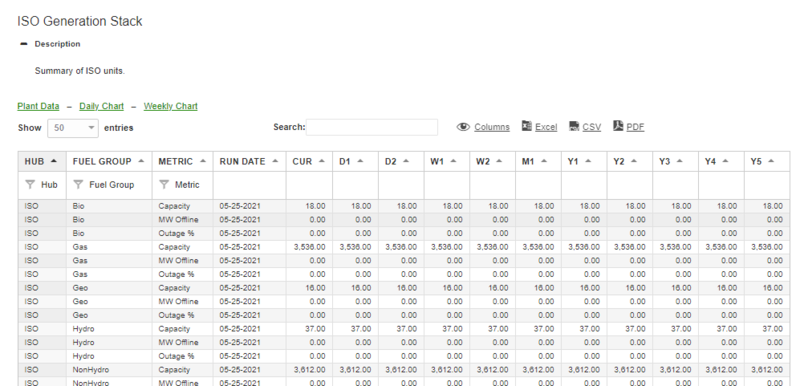
| − | + | This report summarizes the ISO units by fuel type and metrics including Capacity, MW Offline, and Outage %. These metrics are shown across various moments in time including recent days, weeks, and years. | |
| − | The | + | The data can also be charted into daily or weekly lines. |
| − | [[File: | + | [[File:ISO Gen Stack Table.png|alt=Table Depiction|none|thumb|800x800px|Table Depiction]] |
| − | == | + | == ISO Generation Stack == |
| + | *'''Hub:''' The aggregated hub level of corresponding units | ||
| + | *'''Fuel Group''': units aggregated into their respective fuels (Gas, Hydro, Bio, etc.). | ||
| + | *'''Metric''': The data being displayed (Capacity, MW Offline, and Outage %) | ||
*'''Run Date:''' The date in which the report was last updated | *'''Run Date:''' The date in which the report was last updated | ||
| − | *''' | + | *'''Cur''': The most current data |
| − | + | *'''D1-D2''': One to Two days ago | |
| − | + | *'''W1-W2''': One to Two weeks ago | |
| − | + | *'''M1''': One month ago | |
| − | *''' | + | *'''Y1-Y5''': One to five years ago |
| − | |||
| − | |||
| − | |||
| − | |||
| − | |||
| − | * ''' | ||
| − | * ''' | ||
| − | * ''' | ||
== Related Reports == | == Related Reports == | ||
| Line 35: | Line 30: | ||
* EIA 861M (Behind the Meter) | * EIA 861M (Behind the Meter) | ||
* EIA 861M Detail | * EIA 861M Detail | ||
| + | * ISO Generation Stack | ||
== | == | ||
Latest revision as of 12:43, 27 May 2021
Where
Main Menu / Power / Generation / ISO Generation Stack
What
This report summarizes the ISO units by fuel type and metrics including Capacity, MW Offline, and Outage %. These metrics are shown across various moments in time including recent days, weeks, and years.
The data can also be charted into daily or weekly lines.
ISO Generation Stack
- Hub: The aggregated hub level of corresponding units
- Fuel Group: units aggregated into their respective fuels (Gas, Hydro, Bio, etc.).
- Metric: The data being displayed (Capacity, MW Offline, and Outage %)
- Run Date: The date in which the report was last updated
- Cur: The most current data
- D1-D2: One to Two days ago
- W1-W2: One to Two weeks ago
- M1: One month ago
- Y1-Y5: One to five years ago
Related Reports
- ISO Generation Summary
- ISO Generation
- EIA 861M (Behind the Meter)
- EIA 861M Detail
- ISO Generation Stack
==

