Difference between revisions of "California Gas Daily Summary"
Jump to navigation
Jump to search
(→Where) |
(→What) |
||
| Line 10: | Line 10: | ||
[[File:California Gas Daily Summary Table.jpg|alt=Table Depiction|none|thumb|800x800px|Table Depiction]] | [[File:California Gas Daily Summary Table.jpg|alt=Table Depiction|none|thumb|800x800px|Table Depiction]] | ||
| + | |||
| + | |||
| + | [[File:California Gas Map.jpg|alt=California Gas Map|700x700px]] | ||
== Related Reports == | == Related Reports == | ||
Latest revision as of 12:31, 31 May 2021
Where
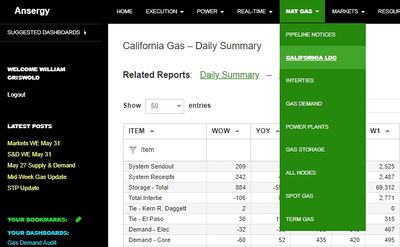
Main Menu / Natural Gas / California Gas Daily Summary
What
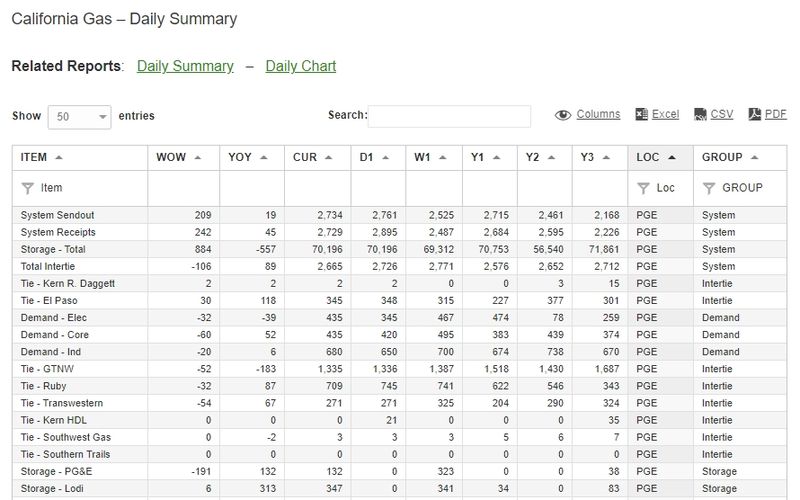
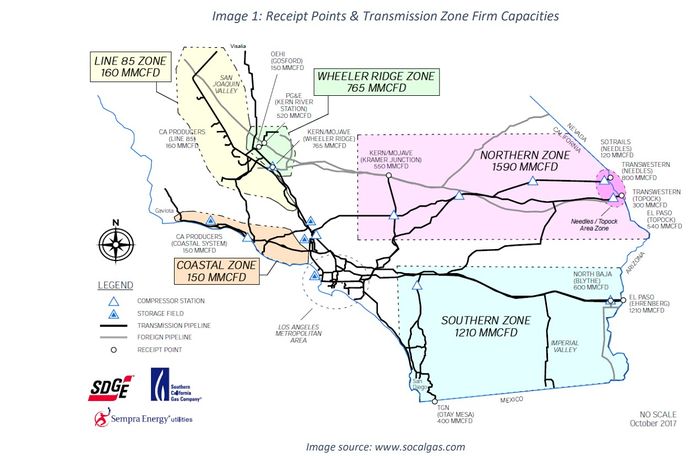
This report contains a detailed summary of various pieces of gas pipeline-related data from both PGE and SoCal Gas. Information includes Intertie flow data, Storage, Production, and Demand. All numbers shown are in MMBTU units.
Related Reports
- Pipeline Notices
- California Gas Daily Summary
==


