Difference between revisions of "TradeRank Roll"
(→Where) |
|||
| (One intermediate revision by the same user not shown) | |||
| Line 1: | Line 1: | ||
=== Where === | === Where === | ||
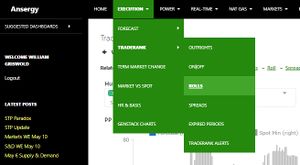
Main Menu / Execution / TradeRank / Roll | Main Menu / Execution / TradeRank / Roll | ||
| − | [[File:Execution-TradeRank-Roll-Menu.jpg|alt= | + | [[File:Execution-TradeRank-Roll-Menu.jpg|alt=|thumb|Roll Menu Location|none]] |
| − | |||
| − | |||
| − | |||
| − | |||
| − | |||
| − | |||
| − | |||
| − | |||
= What = | = What = | ||
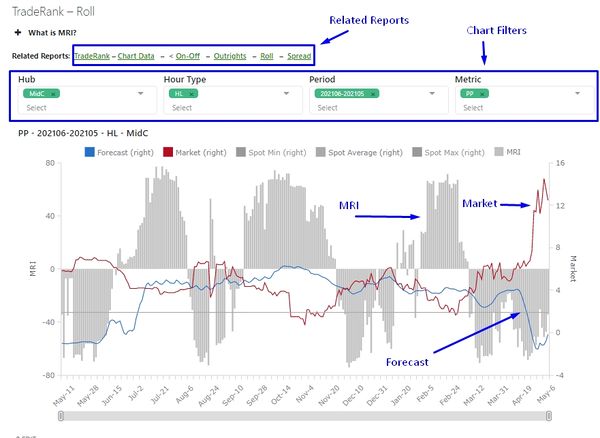
TradeRank plots term market prices against forecasts and prior year cash settles. Market prices are end-of-day ICE settles, the forecasts are from Ansergy’s forecast model, and historical spot prices are the average, maximum, and minimum from the last ten years. | TradeRank plots term market prices against forecasts and prior year cash settles. Market prices are end-of-day ICE settles, the forecasts are from Ansergy’s forecast model, and historical spot prices are the average, maximum, and minimum from the last ten years. | ||
| − | [[File:Execution-TradeRank-Roll-Chart.jpg|alt= | + | [[File:Execution-TradeRank-Roll-Chart.jpg|alt=|thumb|Roll Chart detail|none|600x600px]] |
| − | |||
| − | |||
| − | |||
| − | |||
| − | |||
| − | |||
| − | |||
| − | |||
== TradeRank Derivative Types == | == TradeRank Derivative Types == | ||
| Line 56: | Line 40: | ||
== | == | ||
| + | [[Category:Execution]] | ||
| + | [[Category:TradeRank]] | ||
Latest revision as of 10:26, 1 June 2021
Where
Main Menu / Execution / TradeRank / Roll
What
TradeRank plots term market prices against forecasts and prior year cash settles. Market prices are end-of-day ICE settles, the forecasts are from Ansergy’s forecast model, and historical spot prices are the average, maximum, and minimum from the last ten years.
TradeRank Derivative Types
- Outrights (HL or LL)
- Spreads (one hub vs another hub, same period)
- Rolls (one period vs an adjacent period, same hub)
- On Off (HL - LL, same hub, same period)
MRI - Market Richness Index
MRI is a computed value based upon multiple factors involving the relationship between the market and forecasts, the market against itself, and the market against historical spot settles. For a more detail explanation click here.
How Trade Rank is Used
TradeRank can act as a second opinion on a derivative either for hedging our speculating. MRI has been backcasted and proven to call direction correctly over 60% of the time. The metric is especially useful in comparing one derivative against another. For example, when comparing a buy for June or one in May, you can run rolls and see how each period has performed, relative to the forecast and to past market prices, thereby adding further insight into the relative value of each.
Related Reports
- Forecasts
- 25 Year
- 5 Minute
- Scenarios - 1 Year
- TradeRank
- Outrights
- Spreads
- Rolls
- OnOff
- Expired Periods
- TradeRank Alerts
- Term Market Change
- Market vs Spot
- Heat Rate & Basis
- Stack Charts
- Stack Detail
==

