US ACE Historical Water Flows
Revision as of 09:47, 24 May 2021 by Ansergy (talk | contribs) (Created page with "none|thumb|600x600px === Where === [https://wp.ansergy.com/data/processed-data-hydro/us-ace-water-flows-forebay-elevation-last-14-days/us-ace-hist...")
Where
Main Menu / Power / Hydro / River Conditions / COE Flows / Historical Charts
Why
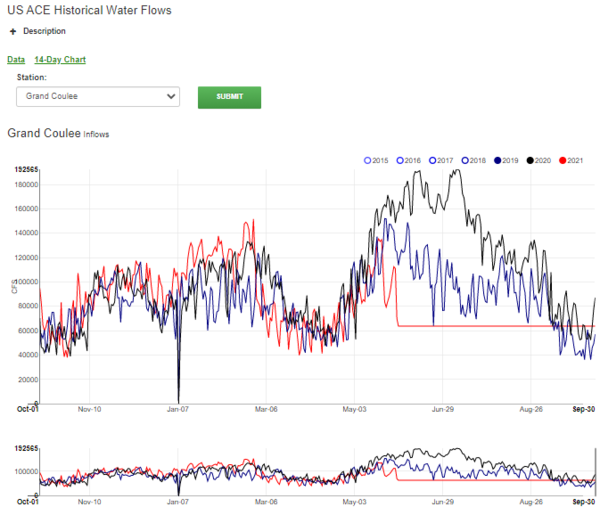
Last five years of weekly average flows for 19 northwest hydro projects. Tip: click the legend name to remove that line from the chart.
What
- Click a colored circle to turn on or off a specific line item
- Variable zoom option available at the bottom of the chart
