California Gas – Daily Chart
Jump to navigation
Jump to search
Where
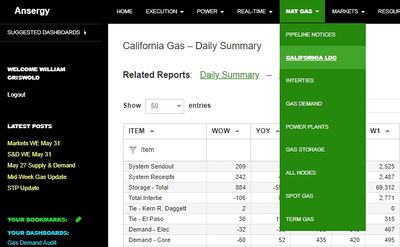
Main Menu / Natural Gas / California Gas Daily Chart This report is found as a link from within the California Daily Summary report.
What
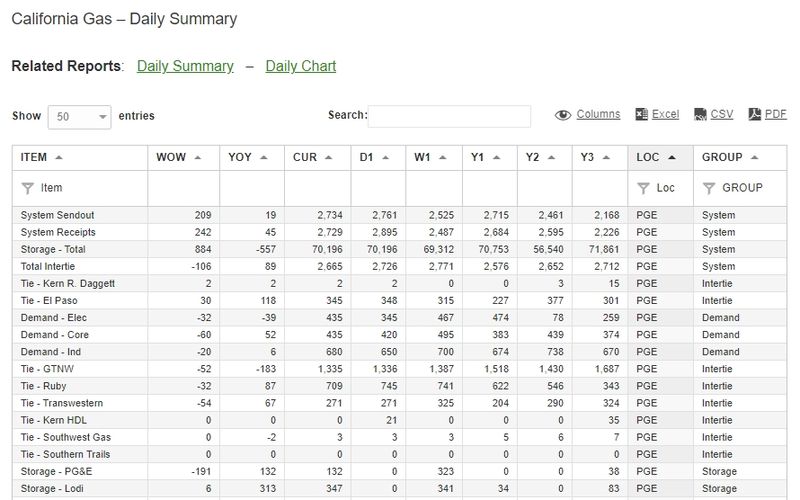
This report contains a detailed summary of various pieces of gas pipeline-related data from both PGE and SoCal Gas. Information includes Intertie flow data, Storage, Production, and Demand. All numbers shown are in MMBTU units.
Related Reports
- Pipeline Notices
- California Gas Daily Summary
==

