Gas Nodal Intertie Weekly
Jump to navigation
Jump to search
Where
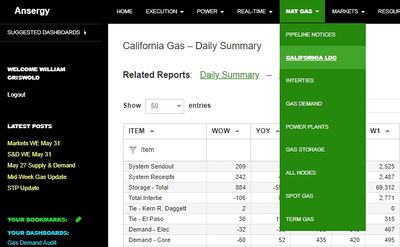
Main Menu / Natural Gas / California Gas Weekly Summary This report is found as a link within the California Gas – Daily Summary page.
What
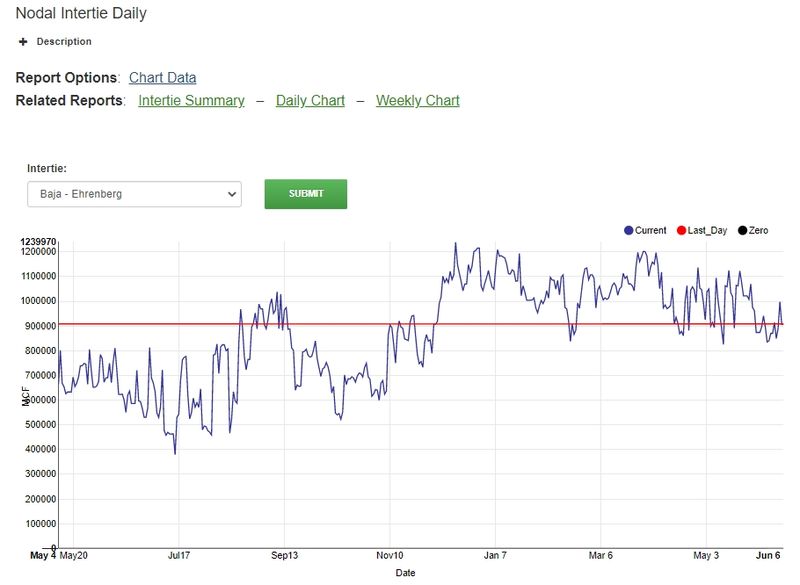
This report contains a weekly chart view of intertie gas data over the past 365 days. Use the Intertie Filter to change the intertie being displayed. Chart lines include Current (actual Intertie data for a particular day), and Last)_Day, which darws a straight line from the most recent day across the chart, allowing for easy comparison between days.
Links to Chart Data, Summary, and Weekly Chart are also available at the top of the report.
Related Reports
- Pipeline Notices
- California Gas Daily Summary
==


