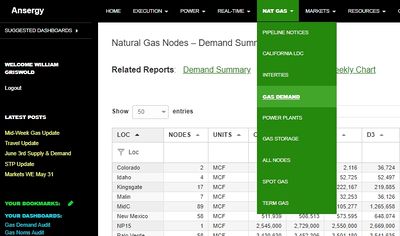
Natural Gas Nodes Demand Daily
Jump to navigation
Jump to search
Where
Main Menu / Natural Gas / Natural Gas Nodes Demand Daily
What
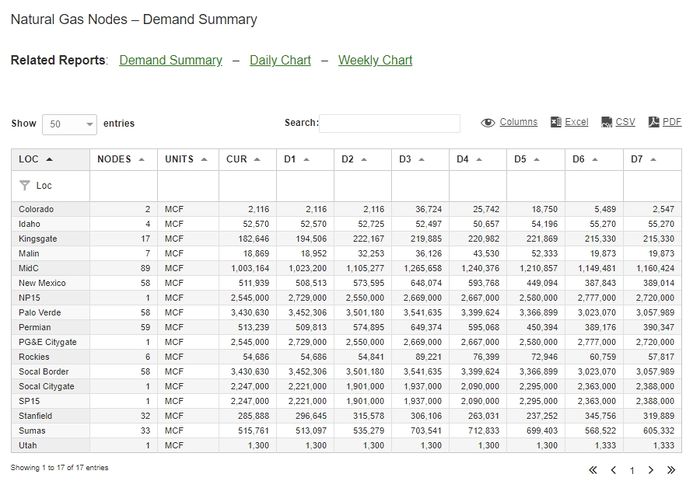
This report shows gas demand as sourced by 300 pipe nodes that represent daily demand. All data is reported at a Power Hub level descripted by the field "Loc".
Fields
- Loc: Location, or Hub of the nodes being summarized
- Nodes: Number of nodes aggregated into the corresponding Location
- Units: Type of data being displayed (ie MCF)
- Cur: The most recent day's data
- D1-D7: Day's prior to current where D1 = yesterday and so on
Links to a Daily and Weekly Chart are also available at the top of the report.
Related Reports
- Pipeline Notices
- Gas Nodes Demand
==

