Realtime Transmission Summary
Revision as of 13:51, 17 June 2021 by Ansergy (talk | contribs) (Created page with "none|thumb|600x600px === Where === [https://wp.ansergy.com/realtime-transmission-summary Main Menu / Power / Transmission / Realtime Transmission...")
Where
Main Menu / Power / Transmission / Realtime Transmission
Why
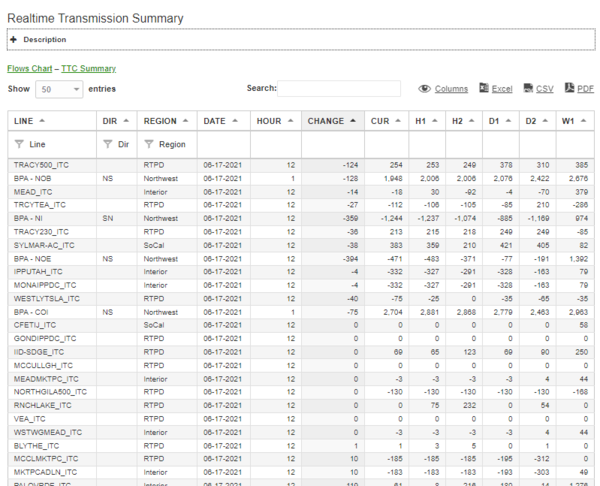
The Transmission real-time report collects flows and TTC every 30 minutes for all the BPA and ISO lines. At a glance, see what is changing in the world of transmission.
What
- Descriptions
- Market – The area observed
- Metric – These are the values we are measuring
- Date & Hour – Hour Ending for current time
- Change – Current Flows minus Yesterday, same Hour (Cur-D1)
- Cur – The last reported Actual
- H1 – One Hour earlier than CUR; traders use this to project out trends
- H2 – Two Hours earlier than CUR
- D1 – Same hour as CUR, but one day back
- D2 – Same hour as CUR, but two days back
- W1 – Same hour as CUR, but one week ago
- Columns - Show or hide columns
- Export to excel, csv or pdf

