Difference between revisions of "Demand+Weather"
Jump to navigation
Jump to search
| Line 1: | Line 1: | ||
[https://wp.ansergy.com/demand-interface/?filters%5Bhub%5D%5B0%5D=BPAT%20-%20demand&filters%5Bhub%5D%5B1%5D=BPAT%20-%20peak_demand&filters%5Bcity%5D%5B0%5D=WA_Seattle%20-%20temperature&filters%5Bcity%5D%5B1%5D=WA_Seattle%20-%20precipitation&reportType=chart&xGrid=true&yGrid=true&axes%5B0%5D%5Bid%5D=1&axes%5B0%5D%5Blabel%5D=MW&axes%5B0%5D%5Bdirection%5D=left&axes%5B0%5D%5Bcolumns%5D%5B0%5D=date&axes%5B0%5D%5Bcolumns%5D%5B1%5D=BCHA%20-%20demand&axes%5B0%5D%5Bcolumns%5D%5B2%5D=BCHA%20-%20peak_demand&axes%5B0%5D%5Bcolumns%5D%5B3%5D=BPAT%20-%20demand&axes%5B0%5D%5Bcolumns%5D%5B4%5D=BPAT%20-%20peak_demand&axes%5B1%5D%5Bid%5D=2&axes%5B1%5D%5Blabel%5D=F%20deg&axes%5B1%5D%5Bdirection%5D=right&axes%5B1%5D%5Bcolumns%5D%5B0%5D=WA_Seattle%20-%20temperature&axes%5B2%5D%5Bid%5D=3&axes%5B2%5D%5Blabel%5D=Inches&axes%5B2%5D%5Bdirection%5D=right&axes%5B2%5D%5Bcolumns%5D%5B0%5D=WA_Seattle%20-%20precipitation&reload=false&grouping=month&chartTypes%5Bdate%5D=line&chartTypes%5BBPAT%20-%20demand%5D=line&chartTypes%5BBPAT%20-%20peak_demand%5D=line&chartTypes%5BWA_Seattle%20-%20temperature%5D=line&chartTypes%5BWA_Seattle%20-%20precipitation%5D=columns Demand + Weather Interface] | [https://wp.ansergy.com/demand-interface/?filters%5Bhub%5D%5B0%5D=BPAT%20-%20demand&filters%5Bhub%5D%5B1%5D=BPAT%20-%20peak_demand&filters%5Bcity%5D%5B0%5D=WA_Seattle%20-%20temperature&filters%5Bcity%5D%5B1%5D=WA_Seattle%20-%20precipitation&reportType=chart&xGrid=true&yGrid=true&axes%5B0%5D%5Bid%5D=1&axes%5B0%5D%5Blabel%5D=MW&axes%5B0%5D%5Bdirection%5D=left&axes%5B0%5D%5Bcolumns%5D%5B0%5D=date&axes%5B0%5D%5Bcolumns%5D%5B1%5D=BCHA%20-%20demand&axes%5B0%5D%5Bcolumns%5D%5B2%5D=BCHA%20-%20peak_demand&axes%5B0%5D%5Bcolumns%5D%5B3%5D=BPAT%20-%20demand&axes%5B0%5D%5Bcolumns%5D%5B4%5D=BPAT%20-%20peak_demand&axes%5B1%5D%5Bid%5D=2&axes%5B1%5D%5Blabel%5D=F%20deg&axes%5B1%5D%5Bdirection%5D=right&axes%5B1%5D%5Bcolumns%5D%5B0%5D=WA_Seattle%20-%20temperature&axes%5B2%5D%5Bid%5D=3&axes%5B2%5D%5Blabel%5D=Inches&axes%5B2%5D%5Bdirection%5D=right&axes%5B2%5D%5Bcolumns%5D%5B0%5D=WA_Seattle%20-%20precipitation&reload=false&grouping=month&chartTypes%5Bdate%5D=line&chartTypes%5BBPAT%20-%20demand%5D=line&chartTypes%5BBPAT%20-%20peak_demand%5D=line&chartTypes%5BWA_Seattle%20-%20temperature%5D=line&chartTypes%5BWA_Seattle%20-%20precipitation%5D=columns Demand + Weather Interface] | ||
| + | |||
| + | [[File:Demand plus weather.png|thumb|Demand plus Weather|alt=|none|600x600px]] | ||
=== Where === | === Where === | ||
| − | Main Menu / Power / Demand / Demand + Weather | + | [https://wp.ansergy.com/demand-interface Main Menu / Power / Demand / Demand + Weather] |
| − | |||
| − | |||
| − | |||
| − | |||
| − | |||
| − | |||
| − | |||
| − | |||
| − | |||
| − | |||
| − | |||
| + | === Why === | ||
| + | Demand plus Weather is a report that allows you to compare a power hubs demand/peak demand verses a weather city based on temperature, precipitation, degree days, cloud cover, humidity or wind speed. | ||
=== What === | === What === | ||
| − | + | [[File:Demand plus Weather.png|thumb|D+W|alt=|none|600x600px]] | |
| − | [[File:Demand plus Weather.png|thumb|D+W|alt=| | ||
* Views - Metric/Period | * Views - Metric/Period | ||
| Line 34: | Line 26: | ||
[[Category:Power]] | [[Category:Power]] | ||
[[Category:Demand]] | [[Category:Demand]] | ||
| + | [[Category:Demand plus Weather]] | ||
Latest revision as of 14:26, 27 May 2021
Where
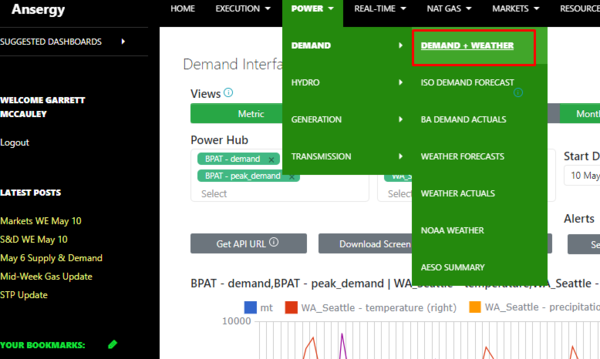
Main Menu / Power / Demand / Demand + Weather
Why
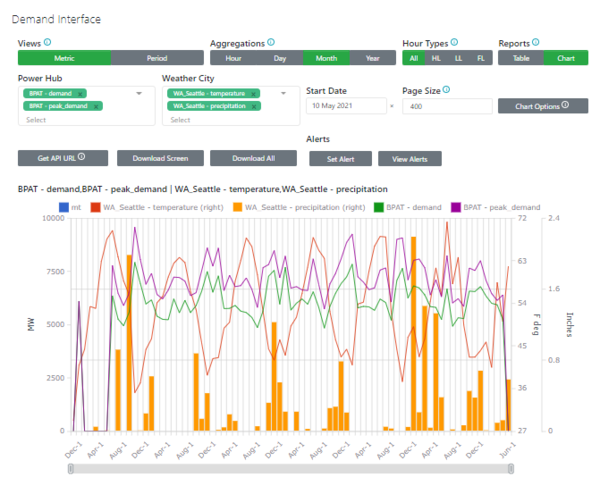
Demand plus Weather is a report that allows you to compare a power hubs demand/peak demand verses a weather city based on temperature, precipitation, degree days, cloud cover, humidity or wind speed.
What
- Views - Metric/Period
- Aggregations - Hour/Day/Month/Year
- Hour Types - All/HL/LL/FL
- Reports - Table/Chart
- Power Hub - Demand/Peak Demand
- Weather City - Temperature/Precipitation/Degree Days/Cloud Cover/Humidity/Wind Speed
- Start Date
- Page Size - Increase or decrease page size to add or subtract days on the chart
- Chart Options - Change chart axes - Left/Right and add description or Show/Hide columns
- Add to an API by clicking the API URL link (may have to contact Ansergy's developers to implement)
- Download Screen - Download data shown in chart
- Set Alert - Create an alert when the data hits a set parameter (see Set Alert Help)

