Generation By Fuel Type
Where
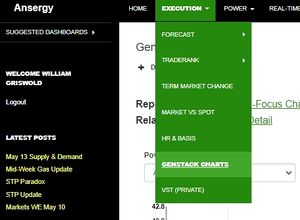
Main Menu / Execution / Generation Stack
What
There are two reports available for Gen Stack -- a chart that plots the Market Price and Ansergy's Forecast Price against cumulative Megawatts of Generation. This chart shows where the current prices are located within the stack, meaning what plants are running in order to serve demand. This chart is helpful in that it also displays the sensitivities of generation as depending on where prices are in the chart, an additional 50 MW of generation can trigger a large increase in price -- or it may result in an increase of just a few cents.
The second available report is the Stack Detail, which is the raw data behind the aforementioned chart. This table displays the actual MW capacity for each plant that serves demand given the price shown in the chart. Be sure to limit the table to a specific power hub in order to get accurate pricing sensitivities.
Stack Detail Fields
- Power Hub
- BA – Balancing Authority
- Owner
- State
- County
- Plant Name
- GenID
- Fuel Group – Ansergy’s fuel mapping
- MW – Nameplate
- Prime Mover – EIA’s prime mover
- Cogen – EIA’s determination of cogen
- Fuel Code – EIA’s Primary Fuel Code
- OLdate – Online Date
- RTdate – Retirement Date
- River Basin – If hydro, the Ansergy Hydro Group
- Wind City – If wind, the wind station
- GasPoint – If gas, the gas hub
Related Reports
- Generation By Fuel Type
