LMP Markets
Where
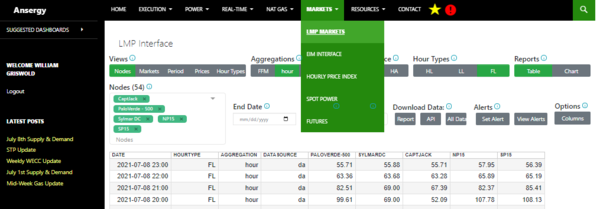
Main Menu / Markets / LMP Markets
What
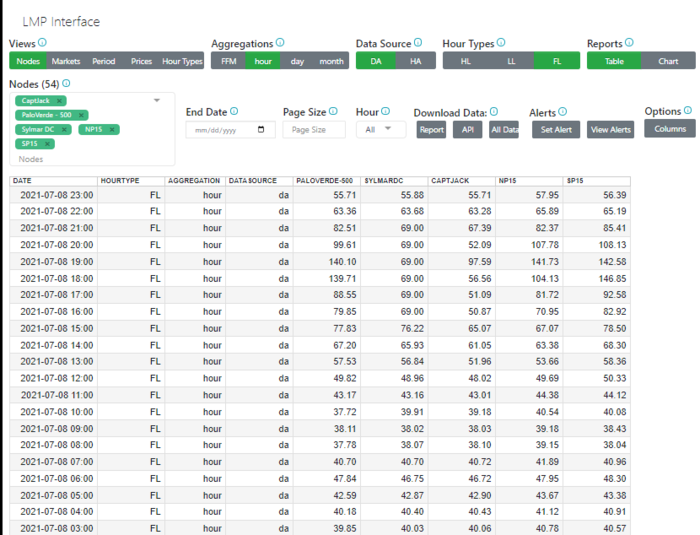
The LMP market report shows Locational Marginal Pricing, which represents the cost of making and the price of electricity and the cost of congestion and losses at points delivering electricity in real time This report offers day ahead and hour ahead prices across 59 different nodes.
Table and Chart Filters
Views - A view is a way to control what is displayed in the columns - think pivot tables. There are five views:
- NodeView - all LMP Nodes are columns with dates and items as records down; this view is useful for viewing two LMPs, side-by-side.
- Markets View - Compare DA vs HA
- Period View - Periods across, hubs and items down. Useful when looking at a single hub to determine changes across time. This view does not plot well.
- Prices View - View the 4 components of price (LMP, Losses, Congestion, and Energy)
- Hour Type View - HL vs LL vs Flat (FL).
Aggregation - Determines how the LMP data is aggregated:
- FFM - 15 Minute; works only for HA
- Hourly - Aggregated into hourly segments
- Daily - Aggregated into Daily segments
Data Source - The LMP interface contains two LMP types:
- DA - Day Ahead
- HA - Hour Ahead
Hour Types - All forecasts are computed hourly, and include an Hour Type View. There are four Hour Type views.
- All - Includes HL, LL, and Flat
- HL - Hours 7-22, Monday through Saturday, excluding holidays
- LL - All non-HL hours
- Flat - 24x7
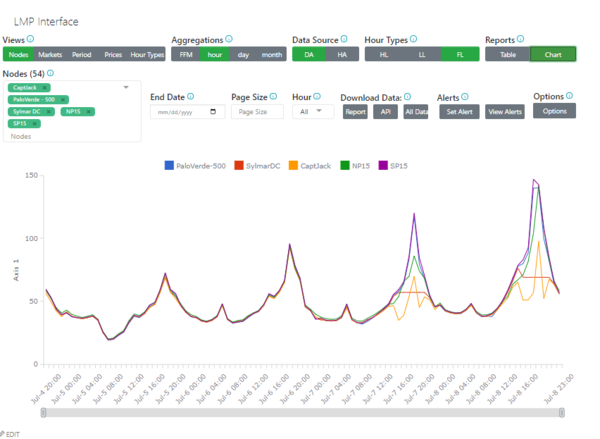
Report Types - This report object allows you to toggle between Data and Chart views. All View controls are available in both reporting types. As a note, some views chart better than others. By default, the chart will attempt to render whatever was selected in the Report View. If that view is not filtered, the chart will be meaningless, usually.
Nodes - The list of available LMPs. Ansergy currently collects data on 59, we can offer others if you like. You can view reports by Node and compare one to others.
End Date - Used for viewing historical data; click the calendar tool to the right and select an end date. Use the Page Size to set the number of records to display.
Page Size - By default, the forecast interface will return 30 records. You can display up to 1000 records in a report by changing the page size to 1000. Enter the integer and hit the [ENTER] key. This feature is useful for creating downloads as the number of records downloaded will be set by the Page Size.
Hour - In hourly aggregation, use the HOUR control to select a single hour, all dates for that hour will be displayed. You will also want to use this field when creating an LMP Alert.
Download Data - Download LMP data, comes with three options.
- Report - Will download whatever you've filtered out
- API - Will generate an API around the filters you've set
- All Data - Pre-aggregated, all nodes, DA and HA
Alerts - You can set an Alert using any mathematical expression against the first record in the table. Sort, filter, etc. to get the correct record in the first row, then click Alerts. View the tutorial to learn how to set an alert.
Options - The Options object allows you to turn on|off the fields, whether in chart or report mode.
Related Reports
- Pipeline Notices
- California Gas Daily Summary
==


