Difference between revisions of "Nodal Power Daily"
Jump to navigation
Jump to search
(Created page with "== Where == [https://wp.ansergy.com/nodal-power-daily-chart/ Main Menu / Natural Gas / Nodal Power Daily] This report link is found within the Nodal Power Summary report page...") |
(→What) |
||
| Line 1: | Line 1: | ||
== Where == | == Where == | ||
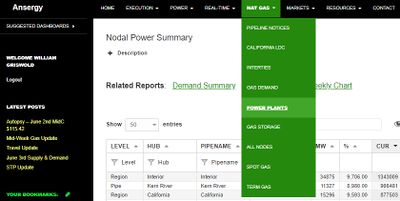
| − | [https://wp.ansergy.com/nodal-power-daily-chart/ Main Menu / Natural Gas / Nodal Power Daily] This report link is found within the Nodal Power Summary report page. | + | [https://wp.ansergy.com/nodal-power-daily-chart/ Main Menu / Natural Gas / Nodal Power Daily] This report link is found within the [https://wp.ansergy.com/nodal-power-summary Nodal Power Summary] report page. |
| Line 7: | Line 7: | ||
= What = | = What = | ||
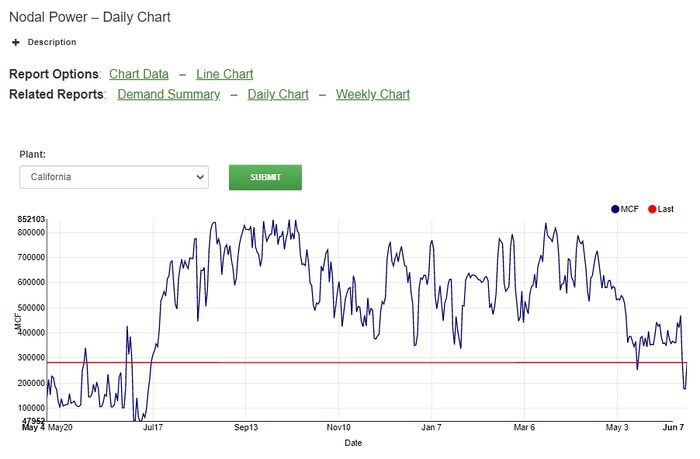
| − | A nodal report based on power plants that draw natural gas from pipelines. This | + | A nodal report based on power plants that draw natural gas from pipelines. This chart is filtered by Plant, select which plant you want displayed by using the dropdown box above the chart and click submit. |
| − | The | + | The chart contains two lines: |
| − | * ''' | + | * '''MCF''': The total MCF for the corresponding day being charted |
| − | + | * '''Last''': The most current day's MCF charted as a straight line across the chart. This is helpful for comparing against previous day's noms | |
| − | |||
| − | |||
| − | * ''' | ||
| − | |||
| − | |||
| − | |||
Links to a Summary, and Daily and Weekly Charts are also available at the top of the report. | Links to a Summary, and Daily and Weekly Charts are also available at the top of the report. | ||
| − | [[File:Nodal Power | + | [[File:Nodal Power Daily Chart.jpg|alt=Chart Depiction|none|thumb|700x700px|Chart Depiction]] |
Latest revision as of 13:05, 7 June 2021
Where
Main Menu / Natural Gas / Nodal Power Daily This report link is found within the Nodal Power Summary report page.
What
A nodal report based on power plants that draw natural gas from pipelines. This chart is filtered by Plant, select which plant you want displayed by using the dropdown box above the chart and click submit.
The chart contains two lines:
- MCF: The total MCF for the corresponding day being charted
- Last: The most current day's MCF charted as a straight line across the chart. This is helpful for comparing against previous day's noms
Links to a Summary, and Daily and Weekly Charts are also available at the top of the report.
Related Reports
- Pipeline Notices
- Gas Nodes Demand
==

