Difference between revisions of "Nuke Status"
Jump to navigation
Jump to search
(→Where) |
(→Where) |
||
| Line 2: | Line 2: | ||
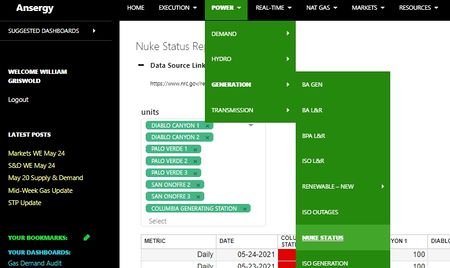
[https://wp.ansergy.com/nuke-status/ Main Menu / Power / Generation / Nuke Status]. | [https://wp.ansergy.com/nuke-status/ Main Menu / Power / Generation / Nuke Status]. | ||
| − | [[File:NukeStatusMenu.jpg|alt=Menu Location| | + | [[File:NukeStatusMenu.jpg|alt=Menu Location|450x450px]] |
= What = | = What = | ||
| − | The | + | The US Nuclear Regulatory Commission releases a plant status report twice a day (4 AM and 8 AM Eastern), this report displays that information in an easy to read format. |
| − | [ | + | Note that 100 signifies the plant is running at full capacity, while 0 represents 0% capacity as the plant is fully offline. |
| − | [[File: | + | |
| + | [https://www.nrc.gov/reading-rm/doc-collections/event-status/reactor-status/ps.html NRC Data Source] | ||
| + | [[File:NukeStatusTable.jpg|alt=|none|thumb|500x500px|Table Description]] | ||
== Outage Summary Fields == | == Outage Summary Fields == | ||
| − | * | + | * Metric: Displays daily, weekly, or yearly aggregations of plant data. Daily is the latest capacity reading for that corresponding date, while weekly and yearly are averages for their respective periods |
| − | * | + | * Date: The date or period being displayed in the respective row |
| − | * | + | * Plant Fields: Plants selected from the "units" filter located above the table will be displayed in this section. The image above contains the six WECC plants. |
| − | |||
| − | |||
| − | |||
| − | |||
| − | |||
| − | |||
| − | |||
| − | |||
| − | |||
== Related Reports == | == Related Reports == | ||
| − | * | + | * Nuke Status |
| − | |||
| − | |||
| − | |||
| − | |||
| − | |||
== | == | ||
| + | |||
[[Category:Power]] | [[Category:Power]] | ||
[[Category:Generation]] | [[Category:Generation]] | ||
| − | [[Category: | + | [[Category:Nuke Status]] |
Latest revision as of 13:09, 24 May 2021
Where
Main Menu / Power / Generation / Nuke Status.
What
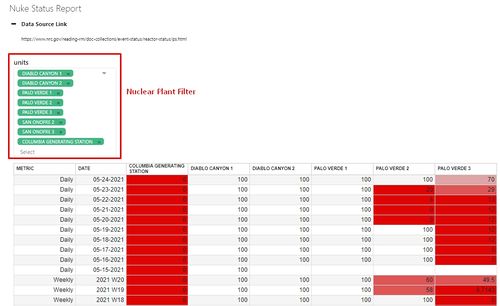
The US Nuclear Regulatory Commission releases a plant status report twice a day (4 AM and 8 AM Eastern), this report displays that information in an easy to read format.
Note that 100 signifies the plant is running at full capacity, while 0 represents 0% capacity as the plant is fully offline.
Outage Summary Fields
- Metric: Displays daily, weekly, or yearly aggregations of plant data. Daily is the latest capacity reading for that corresponding date, while weekly and yearly are averages for their respective periods
- Date: The date or period being displayed in the respective row
- Plant Fields: Plants selected from the "units" filter located above the table will be displayed in this section. The image above contains the six WECC plants.
Related Reports
- Nuke Status
==

