Difference between revisions of "Pipeline Notices"
Jump to navigation
Jump to search
(Created page with "== Where == [https://wp.ansergy.com/notices// Main Menu / Natural Gas / Pipeline Notices] alt=Menu Location|400x400px = What = The EPA (Environmenta...") |
(→Where) |
||
| Line 3: | Line 3: | ||
| − | [[File: | + | [[File:Pipeline Notices Menu.jpg|alt=Menu Location|400x400px]] |
= What = | = What = | ||
| − | + | Ansergy scrapes critical and non-critical notices posted by various Pipelines including: | |
| + | * Gas Transmission Northwest | ||
| + | * Westcoast Energy Inc | ||
| + | * Northwest Pipeline | ||
| + | * SoCal Gas | ||
| − | + | The table includes links to the actual notice and includes a field that signifies the type of notice being displayed (maintenance, force, etc.) | |
| − | + | [[File:Pipeline Notices Table.jpg|alt=Table Depiction|none|thumb|800x800px|Table Depiction]] | |
| − | |||
| − | |||
| − | |||
| − | |||
| − | |||
| − | |||
| − | [[File: | ||
| − | |||
| − | |||
| − | |||
| − | |||
| − | |||
| − | |||
| − | |||
| − | |||
| − | |||
| − | |||
| − | |||
| − | |||
| − | |||
| − | |||
| − | |||
| − | |||
| − | |||
| − | |||
| − | |||
| − | |||
| − | |||
== Related Reports == | == Related Reports == | ||
| − | * | + | * Pipeline Notices |
| − | |||
| − | |||
| − | |||
== | == | ||
[[Category:Natural Gas]] | [[Category:Natural Gas]] | ||
[[Category:Pipeline Notices]] | [[Category:Pipeline Notices]] | ||
Latest revision as of 11:27, 31 May 2021
Where
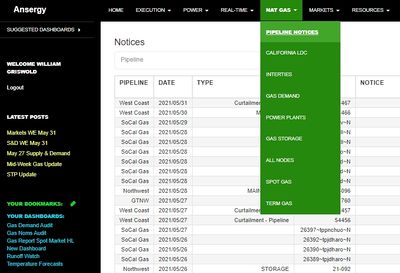
Main Menu / Natural Gas / Pipeline Notices
What
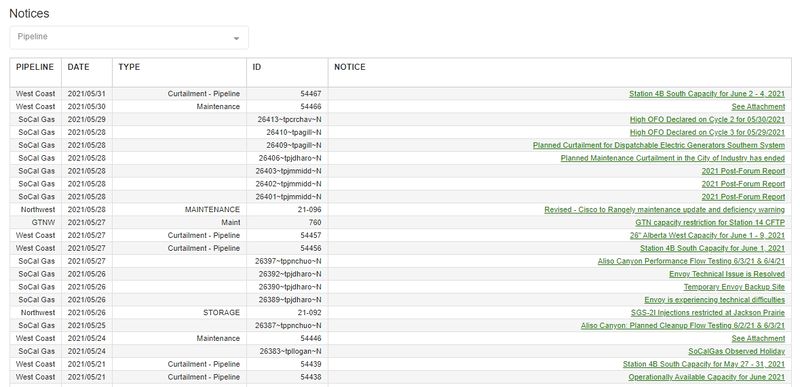
Ansergy scrapes critical and non-critical notices posted by various Pipelines including:
- Gas Transmission Northwest
- Westcoast Energy Inc
- Northwest Pipeline
- SoCal Gas
The table includes links to the actual notice and includes a field that signifies the type of notice being displayed (maintenance, force, etc.)
Related Reports
- Pipeline Notices
==

