Difference between revisions of "STP Daily"
Jump to navigation
Jump to search
(Created page with "none|thumb|600x600px === Where === [https://wp.ansergy.com/data/processed-data-hydro/stp-charts Main Menu / Power / Hydro / STP Reports / STP Daily] =...") |
|||
| Line 12: | Line 12: | ||
* Variable zoom option available at the bottom of the chart | * Variable zoom option available at the bottom of the chart | ||
| + | ==== Report Options: Chart Data – Line Chart ==== | ||
| + | |||
| + | ==== Related Reports: RFC vs. STP – Daily – Month – Year – DOY – By Station – Ansergy vs STP ==== | ||
[[Category:Power]] | [[Category:Power]] | ||
[[Category:Hydro]] | [[Category:Hydro]] | ||
[[Category:STP Daily]] | [[Category:STP Daily]] | ||
Latest revision as of 12:28, 21 May 2021
Where
Main Menu / Power / Hydro / STP Reports / STP Daily
Why
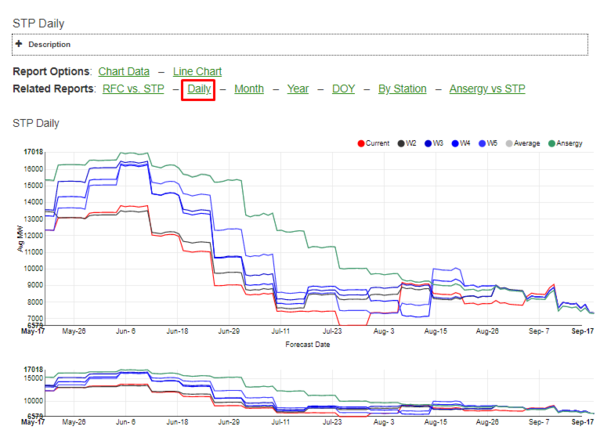
Northwest River Forecast Center 10 Day vs STP – Summary of last five STP reports aggregated into total energy by day. Note: this is not Ansergy’s Mid-C energy forecast as there are plants not covered by the RFC that are included in our forecast. Tip: click the legend name to remove that line from the chart.
What
- Click a colored circle to turn on or off a specific line item
- Variable zoom option available at the bottom of the chart
