Term Market Change
Where
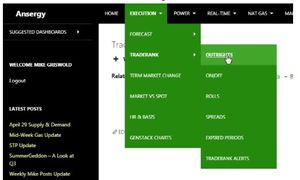
Main Menu / Execution / TradeRank / Outrights
What
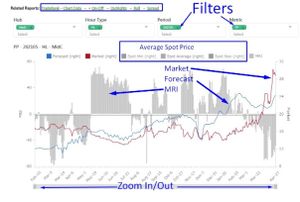
TradeRank plots term market prices against forecasts and prior year cash settles. Market prices are end-of-day ICE settles, the forecasts are from Ansergy’s forecast model, and historical spot prices are the average, maximum, and minimum from the last ten years.
Term Market Change Fields
Date – the most recent term market “as of” date; typically yesterday, unless a weekend or holiday Dtype – Derivative type (H=hourtype; O=outright; S=locational spread; R = Roll) Agg – M = Month; Q = Quarter; Y = Year Metric – HR = Heat Rate; PP = Power Price Rank – sorted on APC (Absolute Value of Percentage Change) for Dtype & Agg; compares all hubs, all periods against each other for those two types Hub – MC, PV, SP, or NP HT – HL, LL, or OO (On Off) Percode – the period APC – Absolute Value of Percentage Change for Today vs Yesterday PC1 – % Change from “Yesterday”: (CUR – D2) / D2 PC2 – % Change from “Two Days Ago”: (CUR – D3) / D3 PC7 – % Change from “Seven Days Ago”: (CUR – D7) / D7 Chg1 – $ change from Yesterday: CUR – D2 Chg2 – $ change from Two Days Ago: CUR – D3 Chg7 – $ change from YSeven Days Ago: CUR – D7 CUR – most recent market price D2 – 2nd most recent market price D3-Dy – other historical market prices Pid – Product ID, used internally Product – Product code, used internally
Related Reports
- Forecasts
- 25 Year
- 5 Minute
- Scenarios - 1 Year
- TradeRank
- Outrights
- Spreads
- Rolls
- OnOff
- Expired Periods
- TradeRank Alerts
- Term Market Change
- Market vs Spot
- Heat Rate & Basis
- Stack Charts
- Stack Detail

