BPA L&R
Jump to navigation
Jump to search
Where
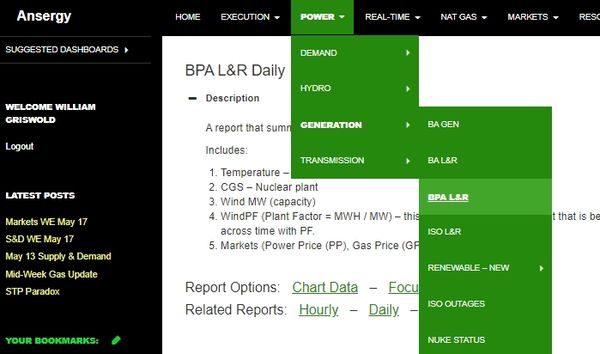
Main Menu / Power / Generation / BPA L&R
What
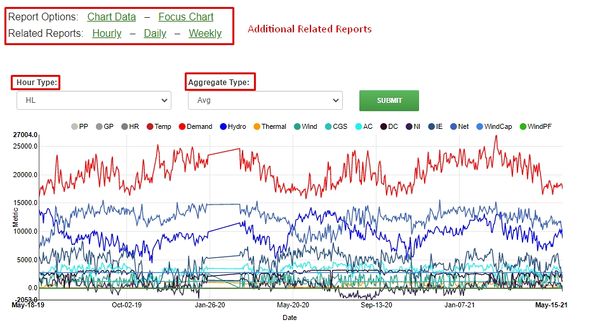
BPA Loads and Resources (BPA L&R). This report contains graphs and tables displaying BPA actuals by fuel type. Data is available in Hourly, Daily, and Weekly aggregations. Select an hour type and an aggregation type (average, minimum, maximum) from the dropdown boxes to display the L&R data.
BPA L&R Fields
- Temperature – based on Portland OR
- CGS – Nuclear plant at Columbia Generating Station
- Wind MW (capacity)
- WindPF (Plant Factor = MWH / MW) – this measures the % of the plant that is being used to generate energy. Now, you can compare BPA wind across time with PF.
- Markets (Power Price (PP), Gas Price (GP), and Heat Rate (HR).
Related Reports
- BA L&R
- BOA L&R
==

