COE Flows
Jump to navigation
Jump to search
Where
Main Menu / Power / Hydro / River Conditions / COE Flows
Why
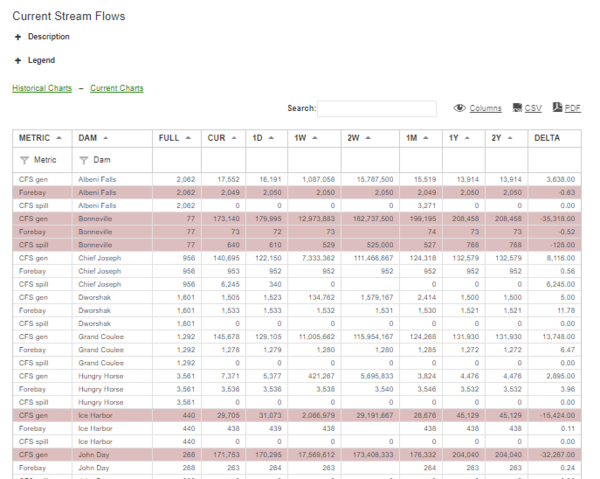
Recap of NW COE hourly project data including QG (generation discharge), QS (spill), and HF (forebay). Click the current chart icon to view the last 90 days of hourly project data; click the historical chart icon to view the last six years of weekly average project data.
What
- Filter metric; CFS Generation, Forebay, CFS Spill
- Variable zoom option available at the bottom of the chart
- 1D – One Day Ago 1W – One Week Ago 2W – Two Weeks Ago 1M – One Month Ago 1Y – One Year Ago 2Y – Two Years Ago Delta – Current minus One Year Ago
