DEMAND CHART
Jump to navigation
Jump to search
Where
Main Menu / POWER / BA DEMAND ACTUALS / DEMAND CHART
What
- Select location then hit submit
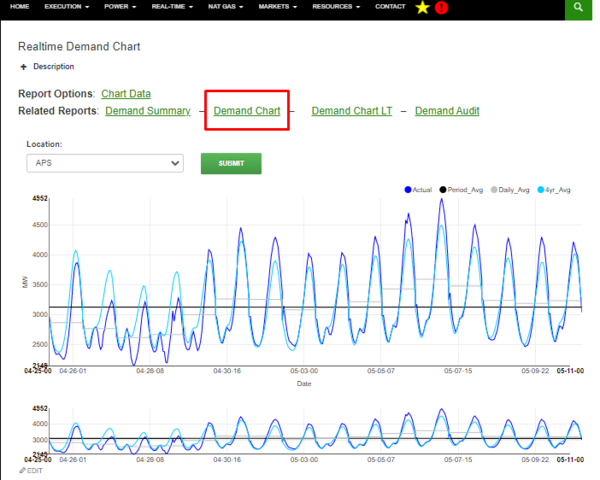
- Compare actuals vs period average vs daily average vs the 4 year average
- Click the colored circle to hide or show data/line
- Focus chart - change date range
