NOAA Weather
Where
Main Menu / Power / Demand / NOAA Weather
Why
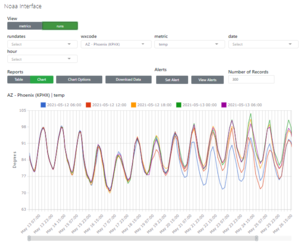
This report allows you to look at a specific weather location and compare previous NOAA runs, including the 0z, 6z, 12z, and 18z
What
- View either by Metrics or Runs
- Filter out selected runs to compare
- Select which location you'd like to research (wxcode)
- Choose your metric - Temperature, Humidity, Wind at 10 meters, Wind at 80 meters (location of windmill blades), cloud cover, pressure or precipitation
- Select future dates or certain hours
- Click table to move from chart to table view. This will show the data for the chart shown
- Chart Options: Label chart axes, and add a second axes
- Select the blue columns to show to hide a column or change the axes, as well as change the line type
- Download Data - Allows you to download all the data shown in the chart or table to CSV
- Click one of the colored boxes to hide that data line in the chart
Set/View Alerts
TradeRank Alerts are often utilized by users that wish to know when a weather metric reaches a desired outcome. When that outcome is reached, an email will be automatically sent to that user's inbox with a notification. A detailed tutorial of how to set and use Alerts can be found on the Ansergy website using this link.
Page Size
By default, the NOAA interface will return 300 records. You can display up to 1000 records in a report by changing the page size to 1000. Enter the integer and hit the [ENTER] key. This feature is useful for creating downloads as the number of records downloaded will be set by the Page Size. This filter also controls the size (or length of time) being displayed in a chart.
