Natural Gas Nodes Demand Weekly
Jump to navigation
Jump to search
Where
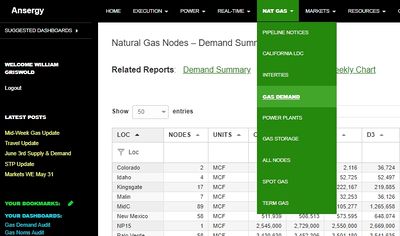
Main Menu / Natural Gas / Natural Gas Nodes Demand Weekly This report can be found as a link within the Natural Gas Nodes – Demand Summary report.
What
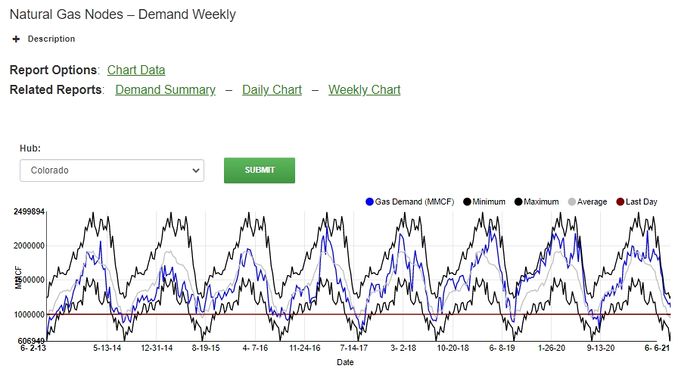
Natural Gas Nodes Demand Weekly shows gas demand as sourced by 300 pipe nodes that represent weekly demand data going back to 2013. All data is reported at a Power Hub level that can be selected from the filter "Hub" located above the chart.
The chart contains several lines:
- Gas Demand (MMCF): Data for the respective hub and date being displayed
- Minimum: The lowest week being currently being displayed, shown as a single line across all days
- Maximum: The highest week being currently being displayed, shown as a single line across all days
- Average: The average from the previous 365 days for the selected hub
- Last day: A single line showing how the most recent day compares to the previous 365 days
Links to a Summary, and Daily and Weekly Charts are also available at the top of the report.
Related Reports
- Pipeline Notices
- Gas Nodes Demand
==

