Nodal Intertie Summary
Jump to navigation
Jump to search
Where
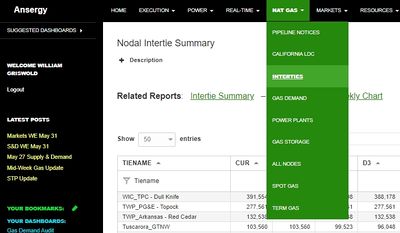
Main Menu / Natural Gas / Nodal Intertie Summary
What
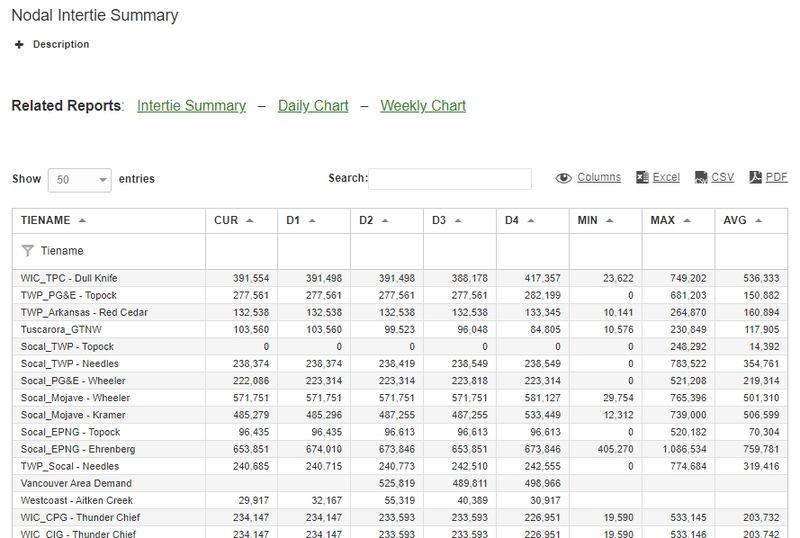
A summary of how gas flows across pipelines. There are over 40 points in the data-set and all are measured in MCF (thousand cubic feet). The table allows the intertie data to be compared across time, specifically from the most current data to the previous four days as well as the historical minimum, maximum, and average.
Related Reports
- Pipeline Notices
- California Gas Daily Summary
- California Gas Daily Chart
==


