Nodal Power Summary
Jump to navigation
Jump to search
Where
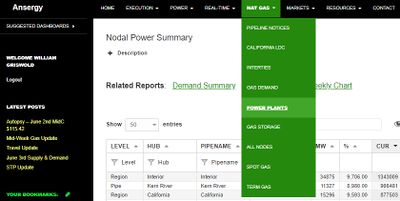
Main Menu / Natural Gas / Nodal Power Summary
What
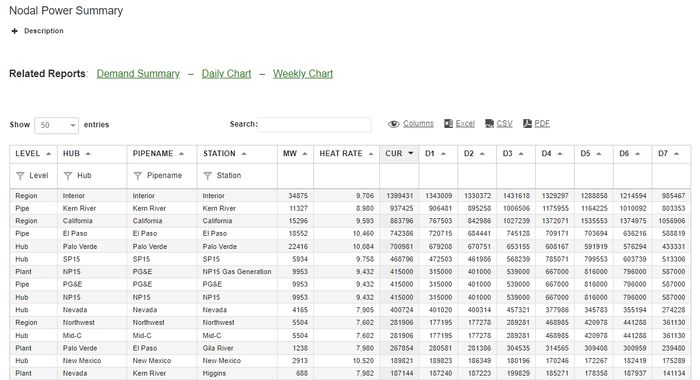
A nodal report based on power plants that draw natural gas from pipelines. This summary organizes plants by Pipeline, Hub, and level/hierarchy of said plant.
The table contains several fields:
- Level: The organized corresponding level of the Hub field being displayed (ie. California is a region, while Palo Verde is a hub)
- Hub: The hub in which the station resides
- Pipename: The pipeline that the corresponding station is fed through
- Station: The aggregation of plants being displayed
- MW: The aggregated max number of MW generated by the station being displayed
- Heat Rate: The heat rate of the associated station
- Cur: The most recent day's gas usage in MCF
- D1-D7: The MCF for days 1 through seven where day 1 is yesterday
Links to a Summary, and Daily and Weekly Charts are also available at the top of the report.
Related Reports
- Pipeline Notices
- Gas Nodes Demand
==

