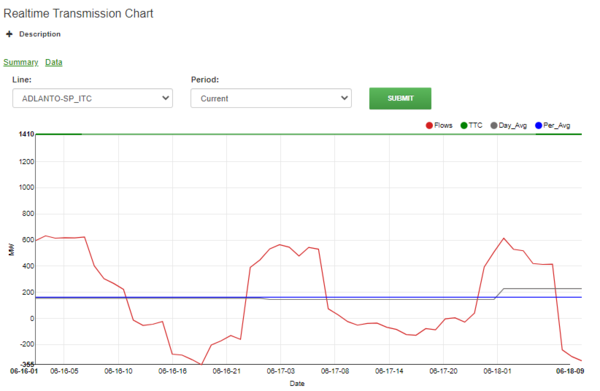
Realtime Transmission Chart
Jump to navigation
Jump to search
Where
Main Menu / Power / Transmission / Realtime Transmission
Why
The Transmission RealTime report uses existing scrapes and is consolidated by line on a single report. The report is primarily a recap of TTC, but we include Flows where we have them (ISO current and BPA one day laghart periods:
- Daily Average or Period Average view
- Current – current day only, 24 hours
- Two days – Current plus yesterday
- Three days – Current plus last two days
- One week – last seven days
- Two weeks – last fourteen days
- Daily Average or Period Average view
What
- Select transmission line and period, then hit submit
- Click the colored circles to show or hide a line
- Toggle off TTC to get a more detailed chart
