Reservoir Watch
Jump to navigation
Jump to search
Where
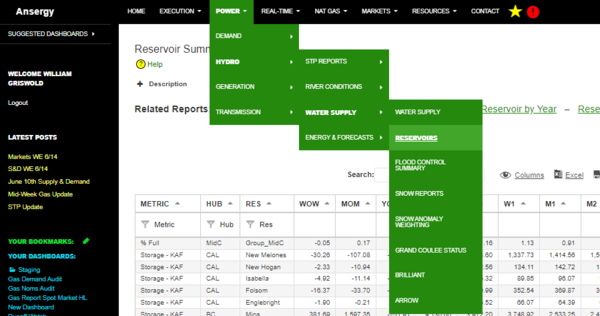
Main Menu / Power / Hydro / Water Supply / Reservoirs The link to this report can be found in the Reservoir Summary report (found in the main menu).
Why
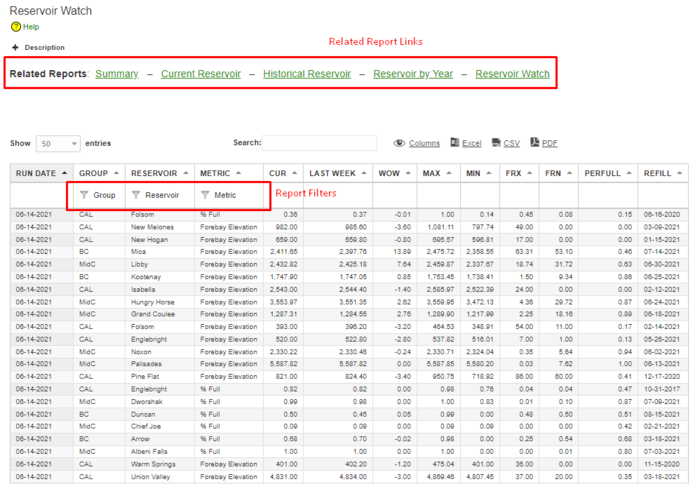
A table that summarizes the change in reservoir levels over the past week and compares that to historical levels in terms of Min, Max and related derivatives.
What
- CUR – Most recent day
- Last Week – Today -8 days
- WOW – Week on week change
- Max – Maximum value in the last 365 days
- Min – Minimum value in the last 365 days
- FRx – Max – Cur
- FRn – Cur – Min
- Refill – The estimated refill date given the WOW and feet until full (Max – Min) / WOW * 7 + Today’s Date

