River Flows
Jump to navigation
Jump to search
Where
Main Menu / Power / Hydro / River Conditions / River Flows
Why
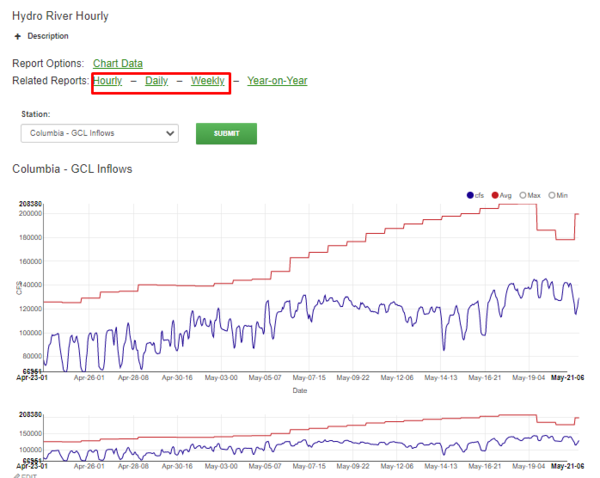
Compare current river conditions to the 10 year average which can help determine where we're at in the run off cycle.
What
- Click a colored circle to turn on or off a specific line item
- Variable zoom option available at the bottom of the chart
- Rundate -The date the report was ran (GMT)
- Hub – Ansergy Power Hub
- River – The major river the Station is on
- Type – Type of station, there are two types
- MW – megawatts, indicates it is one of our forecast stations and will also include a water supply and streamflow forecast
- Reference – a station provided as a reference point
- Station – the name of the point; is either a dam, reservoir, or a gauge on a river
- DOY – Day of Year
- Date – the date (PDT)
- Hour – the hour (PDT)
- CFS – current flows (cubic feet per second)
- Avg – Average for that Day of Year, based upon last ten years where available
- Min – Minimum for that Day of Year, based upon last ten years where available
- Max – Maximum for that Day of Year, based upon last ten years where available
