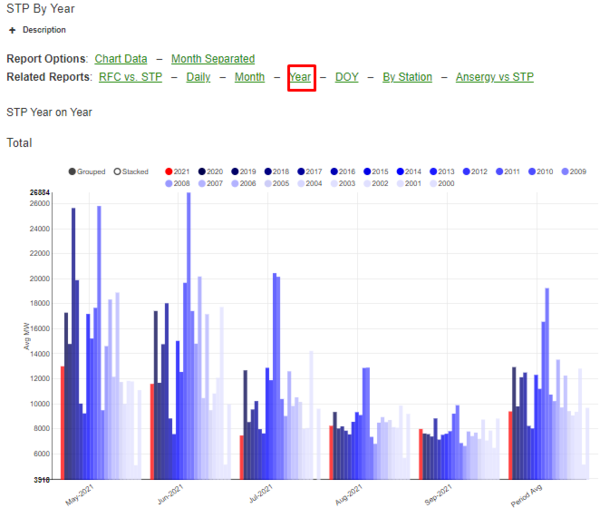
STP Year
Jump to navigation
Jump to search
Where
Main Menu / Power / Hydro / STP Reports / STP by Year
Why
Summary of last five STP reports aggregated into total energy by year. Note: this is not Ansergy’s Mid-C energy forecast as there are plants not covered by the RFC that are included in our forecast. Tip: click the legend name to remove that line from the chart.
The historical years are “actual” energy computed by using actual flows and Ansergy’s proprietary CFS to MWH algorithms.
What
- Click a colored circle to turn on or off a specific line item
- Toggle between grouped or stacked chart view
