Difference between revisions of "ISO LOAD FORECAST DAILY"
Jump to navigation
Jump to search
| Line 1: | Line 1: | ||
=== Where === | === Where === | ||
| − | Main Menu / POWER / DEMAND / ISO DEMAND FORECAST / DAILY CHART | + | [https://wp.ansergy.com/iso-load-forecast-daily/ Main Menu / POWER / DEMAND / ISO DEMAND FORECAST / DAILY CHART] |
| − | [[File:LFD.png| | + | [[File:LFD.png|thumb|alt=|none|600x600px]] |
| − | |||
| − | |||
| − | |||
| + | === What === | ||
| + | * Select location and HT (Hour Type) then click submit | ||
| + | * Compare forecast from today (D1D) VS 2 DAYS VS 3 DAYS VS 1 WEEK (D7D) | ||
| + | * Click the colored circle to hide or show additional data/line | ||
| + | * Loc – the location | ||
| + | ** BANC_SMUD | ||
| + | ** ISO | ||
| + | ** Northwest_IPCO | ||
| + | ** Northwest = IPCO+PACW+PGE+PSEI | ||
| + | ** Northwest_PACW | ||
| + | ** Northwest_PGE | ||
| + | ** Northwest_PSEI | ||
| + | ** NP15 – PG&E | ||
| + | ** Southwest_AZPS | ||
| + | ** Southwest_NEVP | ||
| + | ** Southwest_PACE | ||
| + | ** Southwest = AZPS + NEVP + PACE | ||
| + | ** SP15_MWD | ||
| + | ** SP15_SCE | ||
| + | ** SP15_SDGE | ||
| + | ** SP15 = MWD + SCE + SDGE + VEA | ||
| + | ** SP15_VEA | ||
| + | * Date – the day being forecasted | ||
| + | ** | ||
| + | * HT – there are five hour types | ||
| + | ** Flat – Hours 1 to 24 | ||
| + | ** On-Peak – Hours 7 to 22 | ||
| + | ** Off-Peak – Hours 1 to 6 and 23 to 24 | ||
| + | ** Solar Ramp Up – Hours 11 to 16 | ||
| + | ** Solar Ramp Down – Hours 19 to 21 | ||
| + | * Hours – The number of hours in the hourtype | ||
| + | * D1D – The most recent ISO’s forecast, typically today’s forecast | ||
| + | * D2D – Yesterday’s ISO forecast | ||
| + | * D3D – Three Days ago | ||
| + | * D7D – Seven Days ago | ||
| + | NOTE: The ISO forecasts out seven days, therefore D7D will only have one current date. The other dates are filled in using the last date. | ||
| + | ==== Report Options: [https://wp.ansergy.com/iso-load-forecast-daily-data/ Chart Data] ==== | ||
| − | === | + | ==== Related Reports: [https://wp.ansergy.com/iso-load-forecast-summary/ Summary] – [https://wp.ansergy.com/iso-load-forecast-hourly/ Hourly Chart] – [https://wp.ansergy.com/iso-load-forecast-daily/ Daily Chart] ==== |
| − | |||
| − | |||
| − | |||
| − | |||
[[Category:Power]] | [[Category:Power]] | ||
[[Category:Demand]] | [[Category:Demand]] | ||
| + | [[Category:ISO Load Forecast]] | ||
Latest revision as of 15:37, 27 May 2021
Where
Main Menu / POWER / DEMAND / ISO DEMAND FORECAST / DAILY CHART
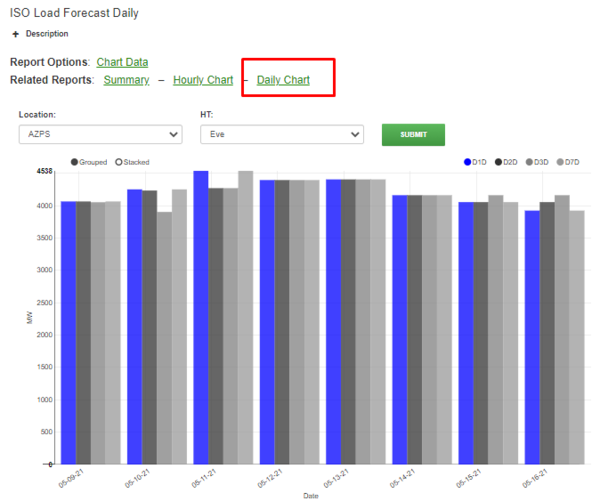
What
- Select location and HT (Hour Type) then click submit
- Compare forecast from today (D1D) VS 2 DAYS VS 3 DAYS VS 1 WEEK (D7D)
- Click the colored circle to hide or show additional data/line
- Loc – the location
- BANC_SMUD
- ISO
- Northwest_IPCO
- Northwest = IPCO+PACW+PGE+PSEI
- Northwest_PACW
- Northwest_PGE
- Northwest_PSEI
- NP15 – PG&E
- Southwest_AZPS
- Southwest_NEVP
- Southwest_PACE
- Southwest = AZPS + NEVP + PACE
- SP15_MWD
- SP15_SCE
- SP15_SDGE
- SP15 = MWD + SCE + SDGE + VEA
- SP15_VEA
- Date – the day being forecasted
- HT – there are five hour types
- Flat – Hours 1 to 24
- On-Peak – Hours 7 to 22
- Off-Peak – Hours 1 to 6 and 23 to 24
- Solar Ramp Up – Hours 11 to 16
- Solar Ramp Down – Hours 19 to 21
- Hours – The number of hours in the hourtype
- D1D – The most recent ISO’s forecast, typically today’s forecast
- D2D – Yesterday’s ISO forecast
- D3D – Three Days ago
- D7D – Seven Days ago
NOTE: The ISO forecasts out seven days, therefore D7D will only have one current date. The other dates are filled in using the last date.
