Nodal Intertie Summary
Jump to navigation
Jump to search
Where
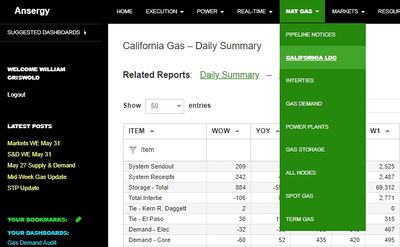
Main Menu / Natural Gas / Nodal Intertie Summary
What
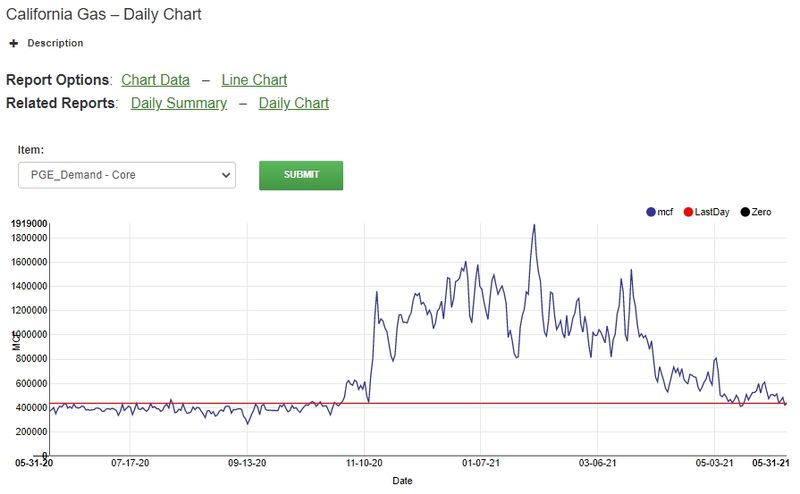
Related to the California Daily Summary report, this report charts items from the Summary into a 365-day image. This data is presented in MCF and includes daily tallies as well as a line showing how the most recent day compares to those over the last year (as shown in red).
Chart data is available as linked near the top of the page.
Related Reports
- Pipeline Notices
- California Gas Daily Summary
- California Gas Daily Chart
==


