Vst
VST Help Page
About
VST = Very Short Term and is Ansergy's frequently updated 21-day forecast. The forecast is updated every 30 minutes and includes nine cases. The service is not part of the standard Ansergy subscription and requires a separate subscription agreement.
Views
A view is a way to control what is displayed in the columns - similar to pivot tables. There are four views:
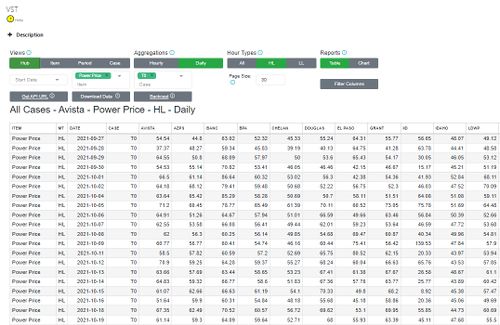
- Hub View - Columns are populated by hubs with dates and items available as filters; this view is useful for This view is useful for plotting one hub against another when a single item is selected.
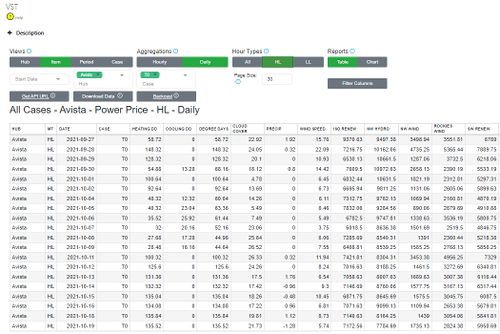
- Item View - Items are columns with dates, hubs, and cases available as filters and records flowing down. The Item View is useful for charting two or more items against each other. For example, plotting hydro against demand, or demand against heat rates. This also allows you to view items as a time series while viewing a table.
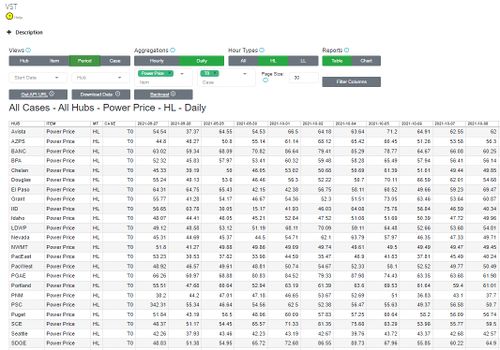
- Period View - Periods are columns while hubs and items flow down. This view is useful when used to determine changes across time. Note that this view does not plot well.
- Case - Hour Types across (HL, LL or Flat) and dates, hubs, and items down. Useful for comparing the hour types and makes a nice On:Off chart.
Cases
| caseid | case | Description |
|---|---|---|
| 1 | T0 | Base Case |
| 2 | T-5NW | Subtract 5 degrees from all Northwest Cities |
| 3 | T+5NW | Add 5 degrees from all Northwest Cities |
| 4 | T-5CA | Subtract 5 degrees from all Calif Cities |
| 5 | T+5CA | Add 5 degrees from all Calif Cities |
| 6 | ND-1000BPAT | Adjust BPAT net demand by -1000 MW |
| 7 | ND+1000BPAT | Adjust BPAT net demand by +1000 MW |
| 8 | ND-1000ISO | Adjust PGAE and SCE net demand by -1000 MW |
| 9 | ND+1000ISO | Adjust PGAE and SCE net demand by +1000 MW |
Backcasts
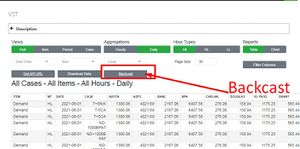
Each of the 48 forecast locations (hubs) are backcasted to either an LMP or a virtual price index. Backcasts are available by clicking the Backcast button.


